


前回は期待値・
問題 5枚のコインを投げあげて、何枚表が出るだろうか。表の出る枚数を確率変数Xとし、確率分布、期待値、分散、標準偏差をそれぞれ求めましょう。
前回と同様、
解説
問題 5枚のコインを投げあげて、
数学的に各値を求める
先ずは数学的に計算してみましょう。
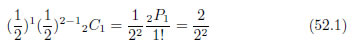
コインを1枚投げあげて表の出る確率は半分です。2枚のコインを投げあげる場合、![]() となります。
となります。
表が1枚だけ出る場合の数は、
具体的な計算式は次の通りです。
2枚とも表が出る場合はたった1つ。以上の計算から表52.
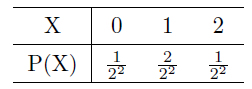
この調子で考えると、
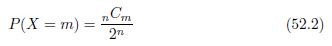
一般式が得られましたので、
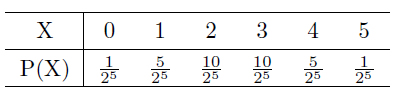
確率分布が得られましたので、
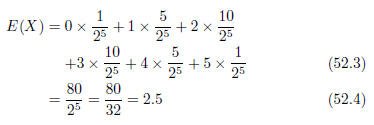
期待値は2.
分散と標準偏差はこの期待値
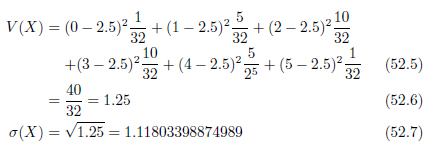
以上で確率分布、
統計的に各値を求める
先ほど数学的に求めた各値をプログラムによるシミュレーションで統計的に求めてみましょう。近い値となるでしょうか。ソースコードと実行結果を続けて示します。
/*
  問題 5枚のコインを投げあげて、何枚表が出るだろうか。表の出る枚数を確率変数\textbf{X}とし、確率分布、期待値、分散、標準偏差をそれぞれ求めましょう。
  filename : Sample_Expectation.java
  uses : Dice.class
 */

import java.util.Arrays;

class Sample_Expectation {

  public static void main(String[] args) {

    int p = 2; //コインの面数
    Dice d2 = new Dice(p); //2 面のダイス
    int n = 5; //コインの枚数
    int trial = 10000; //試行回数
    int front[] = new int[n+1];
    //何枚表だったか。+1 は0 枚の時のこと。
    //1 回の試行で3 枚表になったら++front[3] する。
    double prob[] = new double[n+1];//確率
    double expectation = 0.0; //期待値
    double variance = 0.0; //分散
    double standard_deviation = 0.0; //標準偏差

    //---------------------------------
    System.out.println("2面のダイス(コイン)を"
             +n+"個"+trial+"回振り、"
             +"表の出た枚数をカウントする。");

    for (int j=0; j<trial; ++j){
      int temp_result = 0;
      int FOB = 0; //Front or Back
      for (int i=0; i<n; ++i){//コインはn 枚
        FOB = d2.roll(1);
        if (FOB ==1) ++temp_result;
      }
      ++front[temp_result];
    }

    System.out.println("<試行結果>");
    for (int i=0; i<n+1; ++i){ //結果はn+1 通り。
      System.out.println(i+"枚表は"+front[i]+"回");
    }
    System.out.println("<確率分布>");
    for (int i=0; i<n+1; ++i){
      prob[i] = (double)front[i]/trial;
      System.out.println(i+"枚表 "+prob[i]);
      expectation = expectation + (i*prob[i]);
    }
    System.out.println("<期待値>");
    System.out.println(expectation);
    System.out.println("<分散>");
    for (int i=0; i<n+1; ++i){
      variance +=
        Math.pow((i-expectation),2)*prob[i];
    }
    System.out.println(variance);
    System.out.println("<標準偏差>");
    standard_deviation = Math.sqrt(variance);
    System.out.println(standard_deviation);

  }// end of main

}// end of class Sample_Expectation
上のソースコードの実行結果を示します。1万回を越えると手で計算した結果とシミュレーションの結果がほぼ一致するようです。
C:\>java Sample_Expectation
2面のダイス(コイン)を5 個10000回振り、表の出た枚数をカウントする。
<試行結果>
0 枚表は299 回
1 枚表は1576 回
2 枚表は3132 回
3 枚表は3100 回
4 枚表は1586 回
5 枚表は307 回
<確率分布>
0 枚表 0.0299
1 枚表 0.1576
2 枚表 0.3132
3 枚表 0.31
4 枚表 0.1586
5 枚表 0.0307
<期待値>
2.5019
<分散>
1.24599639
<標準偏差>
1.1162420839584932
今回はここまで
今回は手で計算する問題の結果とシミュレーションで確かめる、