2月も下旬になると暖かい日が増えてきました。新型コロナ対策の緊急事態宣言は続いているものの、
さて前回は、
この種の結果は、
matplotlibの使い方
matplotlibはPythonのパッケージコレクションPyPI
$ python -m pip install -U matplotlib
Defaulting to user installation because normal site-packages is not writeable
Collecting matplotlib
  Downloading matplotlib-3.3.4-cp39-cp39-manylinux1_x86_64.whl (11.5 MB)
     |████████████████████████████████| 11.5 MB 10.3 MB/s
Requirement already satisfied: pillow>=6.2.0 in /usr/lib/python3.9/site-packages (from matplotlib) (8.1.0)
....
  Downloading kiwisolver-1.3.1-cp39-cp39-manylinux1_x86_64.whl (1.2 MB)
     |████████████████████████████████| 1.2 MB 29.9 MB/s
Requirement already satisfied: six in /usr/lib/python3.9/site-packages (from cycler>=0.10->matplotlib) (1.15.0)
Installing collected packages: python-dateutil, kiwisolver, cycler, matplotlib
Successfully installed cycler-0.10.0 kiwisolver-1.3.1 matplotlib-3.3.4 python-dateutil-2.8.1
この例では一般ユーザ権限でインストールしたので、
$ ls ~/.local/lib/python3.9/site-packages/
__pycache__/                                matplotlib/
cycler-0.10.0.dist-info/                    matplotlib-3.3.4-py3.9-nspkg.pth
cycler.py                                   matplotlib-3.3.4.dist-info/
dateutil/                                   mpl_toolkits/
kiwisolver-1.3.1.dist-info/                 pylab.py
kiwisolver.cpython-39-x86_64-linux-gnu.so*  python_dateutil-2.8.1.dist-info/
上記コマンドをルート権限で実行すれば/usr/
matplotlibにはさまざまな機能があるものの、
$ python
Python 3.9.1 (default, Jan 24 2021, 16:05:20)
[GCC 10.2.0] on linux
Type "help", "copyright", "credits" or "license" for more information.
>>> from matplotlib import pyplot
次に適当なX,Yのデータを用意し、
>>> x = [1,2,3,4]
>>> y = [10,30,50,20]
>>> pyplot.plot(x,y)
[<matplotlib.lines.Line2D object at 0x7fe290071580>]
描いたグラフを表示するメソッドpyplot.
>>> pyplot.show()
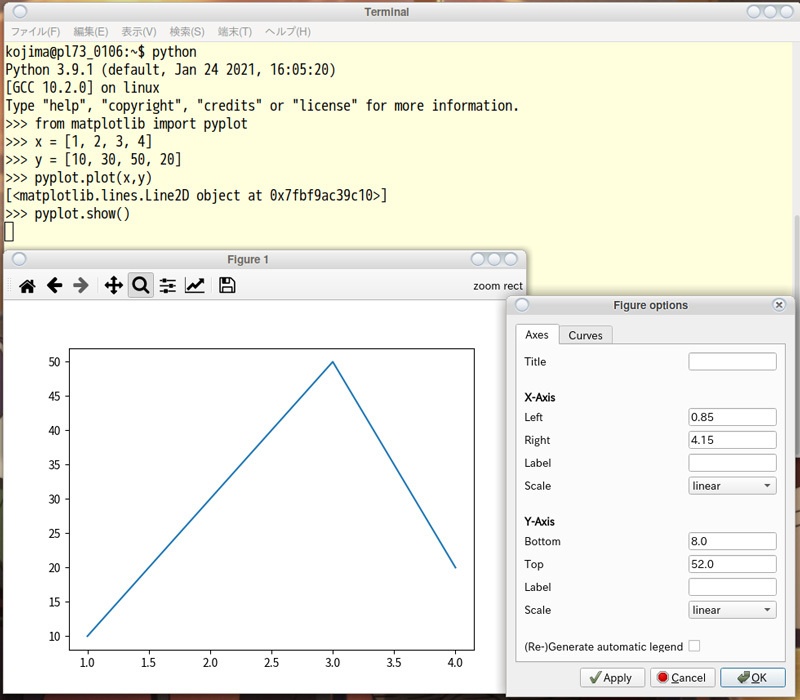
このように、
ガチャ確率のグラフ化
さて、
 1  import random
 2  from matplotlib import pyplot
 3
 4  rate = 0.01
 5  player = 1000
 6  counter = []
 7
 8  for i in range(player) :
 9      c = 1
10      while random.random() > rate :
11          c += 1
12      counter.append(c)
13
14  hist = [0,0,0,0,0,0,0,0,0,0,0]
15  for i in counter:
16      gr = int((i-1) / 10)
17      if gr > 10 :
18          hist[10] += 1
19      else:
20          hist[gr] += 1
21
22  x = [10,20,30,40,50,60,70,80,90,100,110]
23
24  pyplot.bar(x,hist)
25  pyplot.show()
このスクリプトを走らせると、
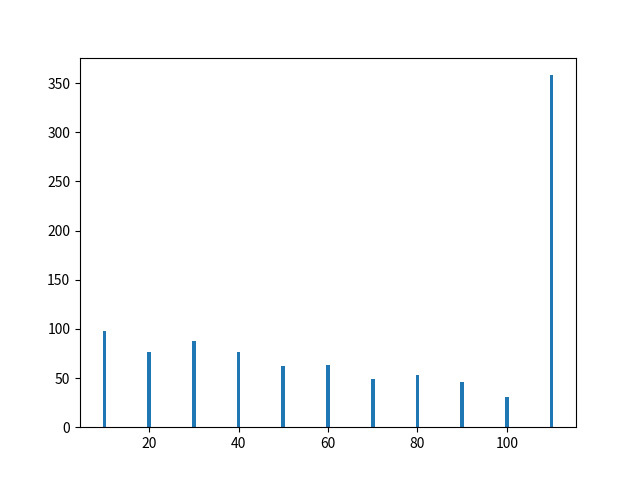
matplotlibで描かれたグラフは、
先のスクリプトでは度数分布を自前で計算したものの、
 1  import random
 2  from matplotlib import pyplot
 3
 4  rate = 0.01
 5  player = 1000
 6  counter = []
 7
 8  for i in range(player) :
 9      c = 1
10      while random.random() > rate :
11          c += 1
12      counter.append(c)
13
14  pyplot.hist(counter)
15  pyplot.show()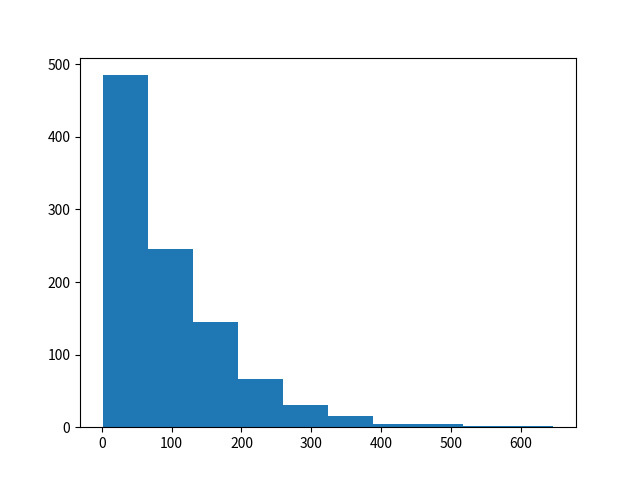
pyplot.
14 pyplot.hist(counter, bins=100)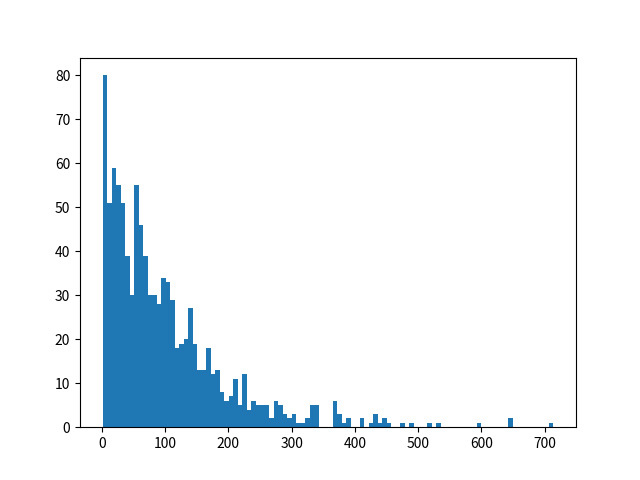
この結果を見ると、
pyplot.
14  pyplot.hist(counter, bins=100, cumulative=True, histtype='step')
15  pyplot.axhline(int(player/4),ls='--',c='red')
16  pyplot.axhline(int(player/2), ls='--', c='red')
17  pyplot.axhline(int(player - player/4), ls='--', c='red')
18  pyplot.show()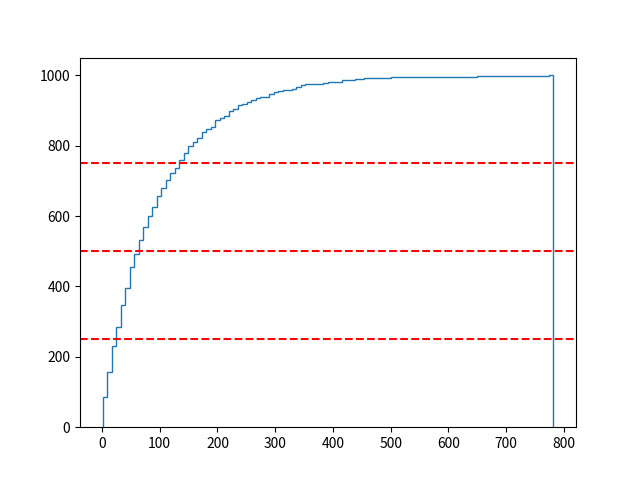
このグラフは一見、
このグラフを見ると、
最後に、
30  pyplot.hist([counter, counter2, counter3], bins=100, cumulative=True, histtype='step', label=['0.01', '0.02', '0.005'])
31  pyplot.axhline(int(player/4),ls='--',c='red')
32  pyplot.axhline(int(player/2), ls='--', c='red')
33  pyplot.axhline(int(player - player/4), ls='--', c='red')
34  pyplot.legend(loc='best')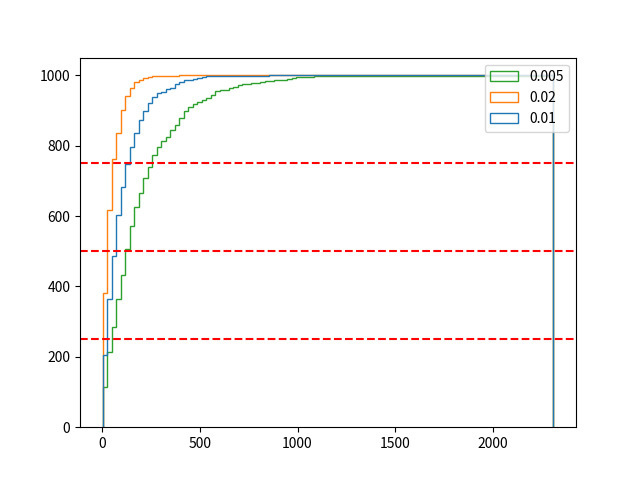
グラフの交点を調べると、
さて、
ネットの世界では、
一方、
ユングの言う


